
Particle Method Benchmark
- Violent Flows Simulated by High-Performance Particle Methods -
Benchmark Tests:
[Test 1] Dam Break on a Wet Bed (Janosi et al., 2004)
[Test 2] A 3D Dam Break and Impact (Kleefsman et al., 2005)
[Test 3] Evolution of a 2D square patch of fluid (Colagrossi, 2003)
[Test 4] A jet impinging on a flat plate (Molteni and Colagrossi, 2009)
[Test 1] Dam Break on a Wet Bed (Janosi et al., 2004)
Test Description:
Because of its distinctive interesting features (Stansby et al., 1998; Khayyer and Gotoh, 2010), a “dam break on a wet bed” serves as an interesting and useful numerical benchmark test to assess the performance of numerical methods in simulation of violent flows.
Here we consider a “dam break on a wet bed” corresponding to the experiment by Janosi et al. (2004) as the first benchmark test. Fig. 1 shows a schematic sketch of the experimental setup, while, detailed information on the dimensions as well as numerical conditions have been listed in Table 1.
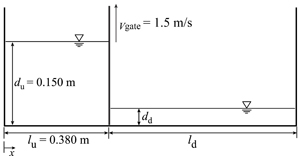
Fig. 1. Schematic sketch of the experimental setup
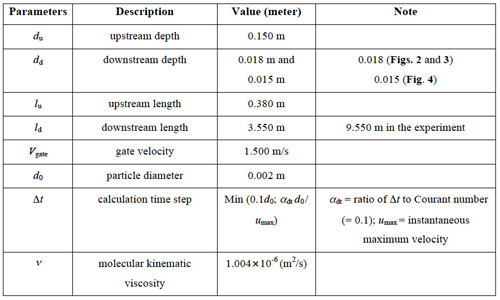
Table 1. Detailed information on experimental and numerical setups
Answer by High-Performance Particle Methods:
Figs. 2 and 3 show sequential experimental photos (Janosi et al., 2004) and their corresponding simulation snapshots by CMPS-HS (Khayyer and Gotoh, 2009), MPS (Koshizuka and Oka, 1996), CISPH-HS (Khayyer, Gotoh, Shao, 2009), ISPH (Shao and Lo, 2003), WCSPH-MLS (Gomez-Gesteira et al., 2008) and WCSPH (Gomez-Gesteira et al., 2008) methods. In Fig. 2(m,y) (Fig. 2(m) and (y)) a(alpha) represents the coefficient of artificial viscosity term. In Fig. 3(s-y), transparent snapshots by the three improved particle methods (CMPS-HS, CISPH-HS and WCSPH-MLS) have been overlaid on their corresponding experimental photographs to provide a clearer comparison between the applied numerical methods and to highlight the relatively high precision of the improved particle methods.
Apart from the assessments made on the reproduced free-surface profile, one of the interesting evaluations can be related to the ability of numerical methods in simulation of dynamics of mixing processes especially when large deformations exist (as in case of a dam break on a wet bed). In the experiments by Janosi et al. (2004) clear water (upstream of the gate; depth = 0.150 m) was released into a channel containing a colored (dyed) ambient fluid layer (downstream of the gate; depth = 0.015 m). In Fig. 4, three experimental photos are shown together with their corresponding numerical snapshots obtained by the improved and standard versions of the applied particle methods.
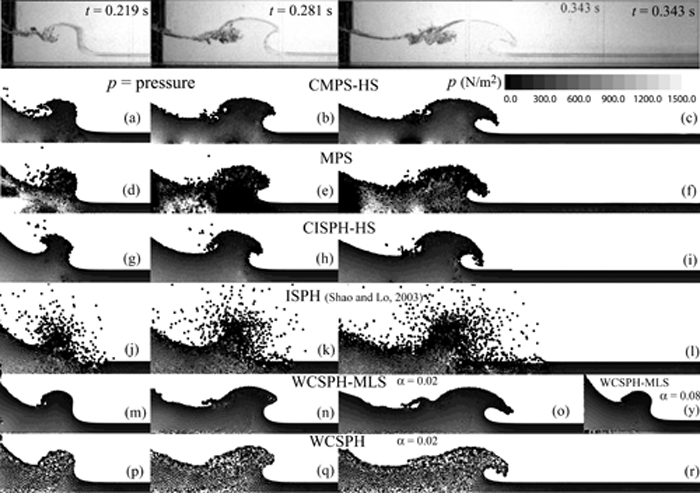
Fig. 2. Experimental photos (Janosi et al., 2004) and their corresponding particle-based simulation snapshots at t = 0.219 s, t = 0.281 s and t = 0.343 s
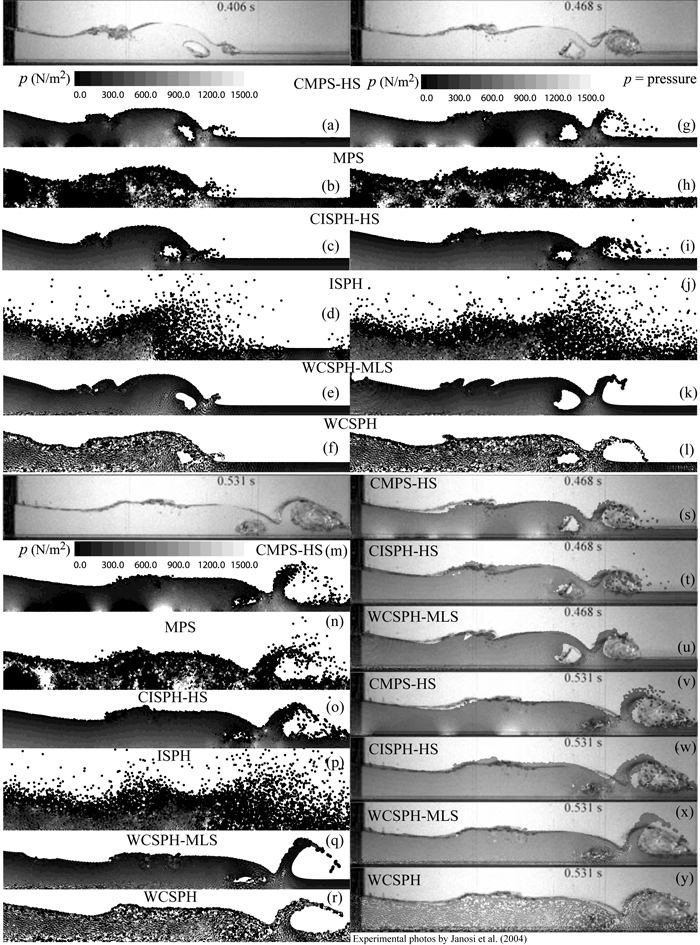
Fig. 3. Experimental photos (Janosi et al., 2004) and their corresponding particle-based simulation snapshots at t = 0.406 s, t = 0.468 s and t = 0.531 s
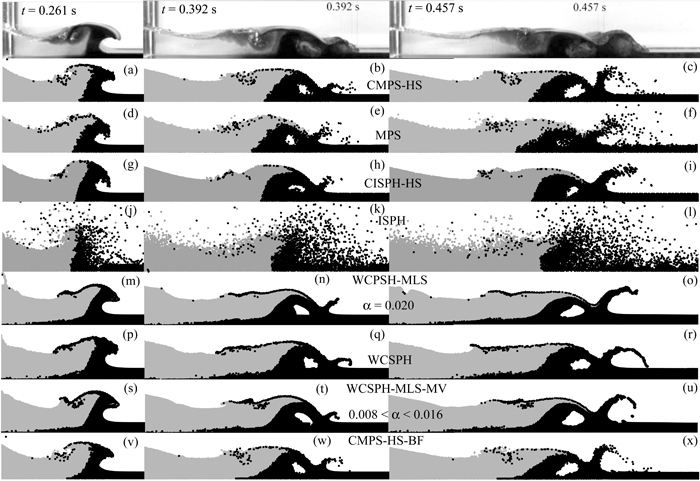
Fig. 4. Simulation of mixing processes in a dam break on a wet bed (Janosi et al., 2004) by improved and standard versions of MPS, ISPH and WCSPH methods
References:
Gomez-Gesteira, M., Rogers, B.D., Dalrymple, R.A., Crespo, A.J.C., Narayanaswamy, M., 2008. User guide for the SPHysics code, February 2008.
Janosi, I. M., Jan, D., Szabo, K.G., and Tel, T., 2004. Turbulent drag reduction in dam-break flows. Exp. Fluids, 37, 219-229.
Khayyer, A., Gotoh, H., 2009. Modified Moving Particle Semi-implicit methods for the prediction of 2D wave impact pressure. Coastal Engineering, 56(4), 419-440.
Khayyer, A. and Gotoh, H., 2010. On particle-based simulation of a dam break over a wet bed, Jour. Hydraulic Res., IAHR, Vol. 48(2), 238-249.
Khayyer, A., Gotoh, H., Shao, S.D., 2009. Improved Incompressible SPH methods for the prediction of wave impact pressure. Applied Ocean Research, 31, 111-131.
Koshizuka, S. and Oka, Y., 1996. Moving particle semi-implicit method for fragmentation of incompressible fluid. Nuclear Science and Engineering 123, 421-434.
Shao, S. D. and Lo, E. Y. M., 2003. Incompressible SPH method for simulating Newtonian and non-Newtonian flows with a free surface. Advances in Water Resources, 26 (7), 787-800.
[Test 2] A 3D Dam Break and Impact (Kleefsman et al., 2005)
Test Description:
Schematic dam break flows have been widely used for the verification of numerical methods. An Experiment on a schematic dam break flow and its impact against an obstacle has been carried out at the MAritime Research Institute Netherlands (MARIN) as reported by (Kleefsman et al. (2005). This experiment has been considered as a benchmark test for the validation of particle methods and some grid-based methods.
A schematic sketch of the calculation domain including the positions of the wave height probes and pressure sensors is shown in Fig. 1. Detailed descriptions of the experiment as well time histories of pressures and water heights have been provided by Kleefsman et al. (2005).
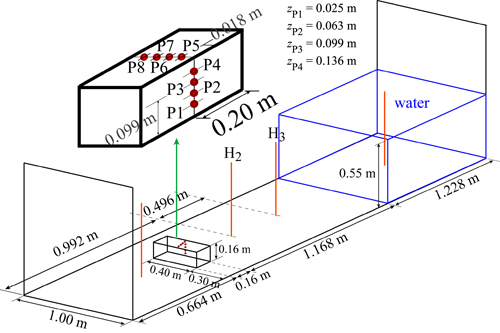
Fig. 1. Schematic sketch of the computational domain
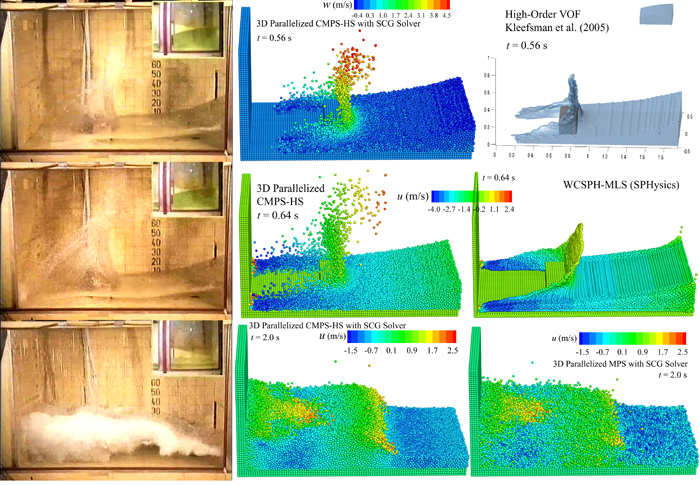
Fig. 2. Snapshots of water particles at t = 0.56 s (top), t = 0.64 s (middle) and t = 2.0 s (bottom) – comparisons between experiment (Kleefsman et al., 2005), 3D parallelized CMPS-HS, a high-order VOF (Kleefsman et al., 2005), WCSPH-MLS (SPHysics code, Gomez-Gesteira et al., 2008) and 3D Parallelized MPS
Answer by High-Performance Particle Methods:
Fig. 2 illustrates experimental photos at t = 0.56 s (top), t = 0.64 s (middle), and t = 2.00 s (bottom) as well as their corresponding numerical results by a 3D parallelized CMPS-HS method, high-order VOF (Kleefsman et al., 2005), WCSPH-MLS (SPHysics code, Gomez-Gesteira et al., 2008) and 3D Parallelized MPS method. From this figure at t = 0.560 s, a straight, upward and integrated jet has been obtained by a high-order VOF method. This is not in a good agreement with the experiment as the jet seen in the experimental photograph has been curled back towards the incoming flow. Moreover, the experimental jet is characterized by considerable fluid fragmentations which are not reproduced in the VOF snapshot. On the other hand, the CMPS-HS method has been able to simulate the backward curl of the jet. In addition, fluid fragmentations have been reproduced by the CMPS-HS.
At t = 0.64 s, the WCSPH-MLS method has provided an integrated jet without the reproduction of fluid fragmentations. The backward curl of the jet has been simulated to some extend by this method. The snapshot by the 3D parallelized CMPS-HS method appears to be in a good agreement with the experiment as the height of jet, its curling back and physical fluid fragmentations have been fairly well simulated.
At t = 2.0 s, existence of considerable numerical noise in the horizontal velocity field by 3D parallelized MPS is evident. On the other hand, the 3D parallelized CMPS-HS method has resulted in a smoother velocity field with less numerical noise. Accordingly, a refined simulation of the macroscopic features of the flow (such as the main vortices) has been illustrated by this method.
Fig. 3 presents a qualitative comparison in terms of the simulated pressure field (at t = 0.560 s) between the 3D parallelized CMPS-HS and the 3D parallelized MPS methods. From this figure, the 3D parallelized MPS has resulted in a spurious pressure field. Conversely, a significantly enhanced pressure calculation has been provided by the 3D parallelized CMPS-HS method.
Fig. 4(a) shows the pressure time histories at measuring point P1. From this figure, 3D parallelized CMPS-HS results in a significantly enhanced time variation of pressure (in comparison to 3D parallelized MPS) and an acceptable calculation of peak pressure together with its rise and declination. From this figure, the pressure results by 3D parallelized CMPS-HS are comparable to those by the high-order VOF method but appear to be slightly more fluctuating. Yet, as seen in Fig. 2, the 3D parallelized CMPS-HS provides a more realistic reproduction of the jet.
Fig. 4(b) depicts time variation of water height at measuring probe H3. From this figure, the 3D parallelized CMPS-HS method provides an enhanced estimation of water height variations at H3. Despite slight overestimations of water height value and rise time, the overall trend of the water height variations has been fairly well predicted by the 3D parallelized CMPS-HS method.
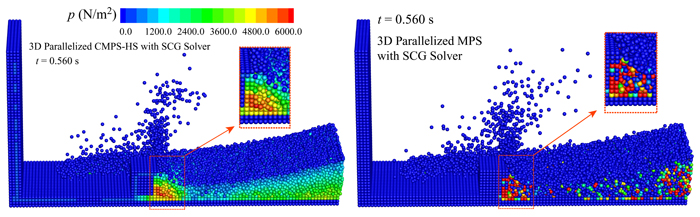
Fig. 3. Qualitative comparison in terms of the reproduced pressure field by the 3D parallelized CMPS-HS and the 3D parallelized MPS methods (t = 0.56 s)
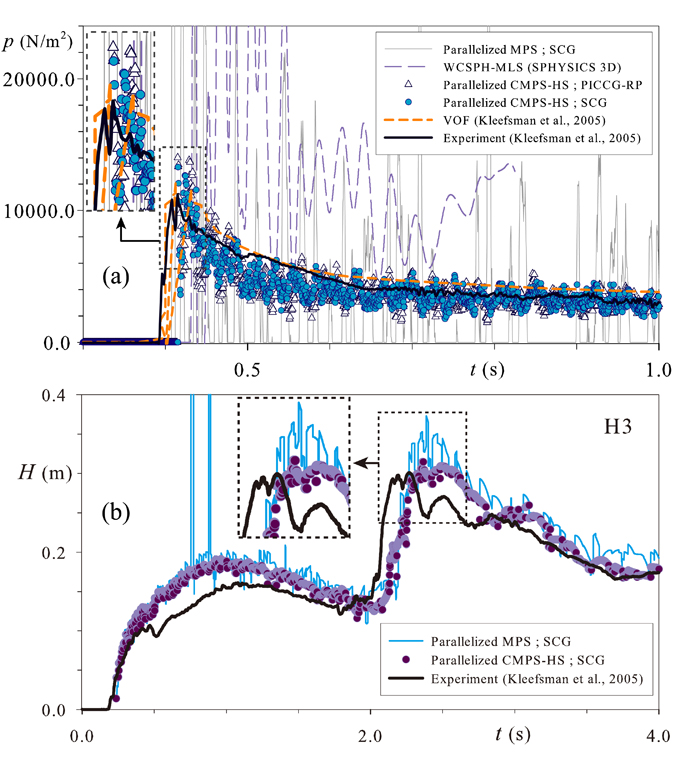
Fig. 4. Time histories of pressure at measuring points P1 (a), and water height at measuring point H3 (b)
References:
Gomez-Gesteira, M., B.D. Rogers, R.A. Dalrymple, A.J.C. Crespo and M. Narayanaswamy (2008): User guide for the SPHysics code, v1.4.
Kleefsman, K.M.T., G. Fekken, A.E.P. Veldman, B. Iwanowski and B. Buchner (2005): A Volume-of-Fluid based simulation method for wave impact problems, J. Comput. Phys. 206, pp. 363-393.
[Test 3] Evolution of a 2D square patch of fluid (Colagrossi, 2003)
Test Description:
The evolution of a 2D square patch of fluid has been used (e.g. Le Touze and Colagrossi, 2005; Oger et al., 2007; Fang et al., 2009) as a benchmark test to evaluate the stability and accuracy of SPH-based models in reproduction of tensile stresses. In this test, a weightless, initially square patch of fluid is subjected to the following velocity field:
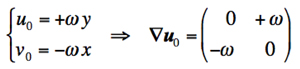
where w(omega) and u0 denote an arbitrary angular velocity and a pure rigid rotation around the center of the initial square. The evolution of the fluid patch is governed by the continuity and the Euler equation. The specified pure rigid rotation results in centrifugal forces and accordingly negative pressure fields. Further, due to the resulting centrifugal forces the corners of the patch are stretched and form into four fluid arms.
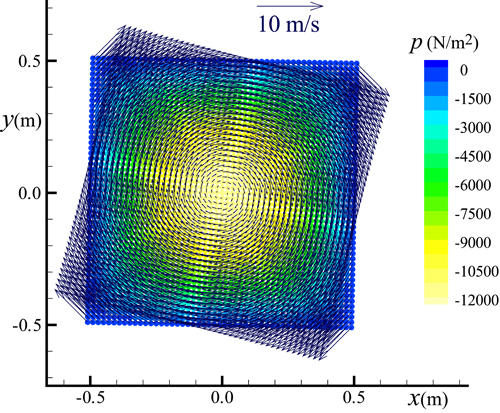
Fig. 1. A 2D square patch of fluid subjected to a pure rigid rotation - schematic sketch of computational domain, velocity and pressure fields just at the beginning of calculation
Answer by High-Performance Particle Methods:
The initial square is considered to be 1.0 m in length (L = 1.0 m). Unlike some previous SPH-based works, we do not consider any viscous forces for numerical stabilization. The particle size is considered as d0 = 2.0E-3 m. Fig. 1 shows a schematic sketch of calculation domain and the velocity vectors as well as the pressure fields just at the beginning of calculation.
Fig. 2 illustrates the snapshots of water particles together with the pressure field by MPS and Improved MPS methods. This figure shows a typical snapshot by MPS at t = 0.064 s characterized by a spurious pressure field and dispersed particles at the patch corners. For this specific test, the MPS simulation fully breaks up at t = 0.084 s. On other hand, the improved MPS method provides a fully stable simulation of the patch with significant enhancements in reproduction of pressure field.
Fig. 3 shows time histories of calculated pressure at a particle located at the center of the patch. It is evident that the MPS method has resulted in an unphysical pressure calculation. Improved MPS method, on the other hand, provides a significantly enhanced time history of pressure. To further evaluate the performance of improved MPS method, the simulation has been redone with different spatial resolutions corresponding to particle diameters of 3.3, 2.5 and 1.5 mm. In general, refinement of spatial resolution has resulted in enhancement of solution. Further, the stability of improved MPS simulations does not seem to depend on the spatial resolution.
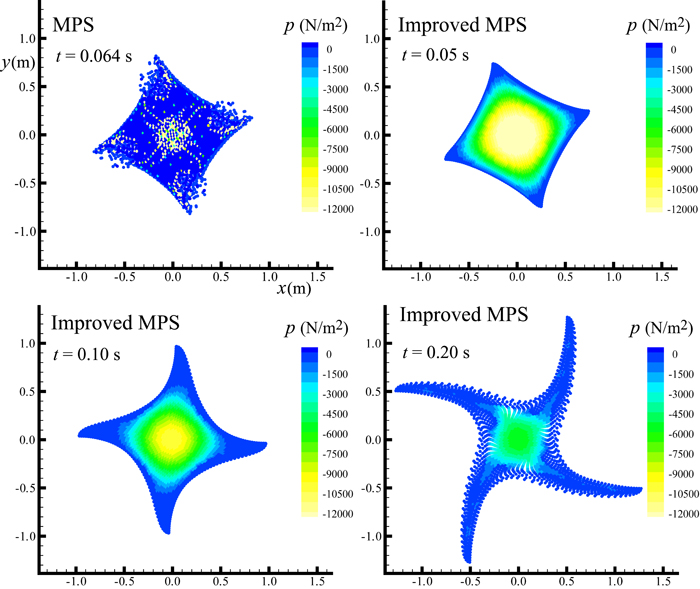
Fig. 2. Snapshots of water particles together with the pressure field
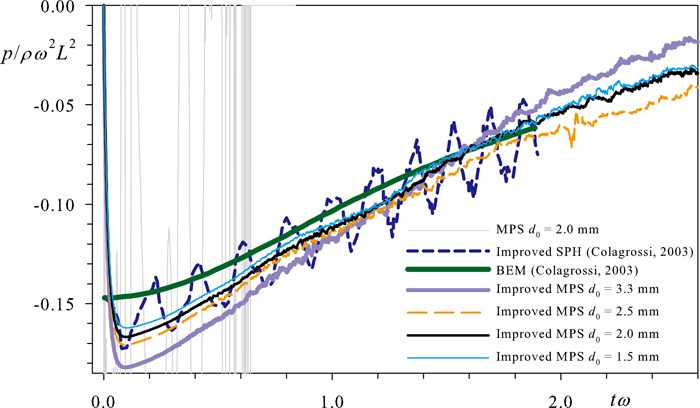
Fig. 3. Time histories of calculated pressure at a particle located at the center of the patch
References:
Colagrossi, A., 2003. A meshless Lagrangian method for free-surface and interface flows with fragmentation”, PhD Thesis, Universita di Roma, La Sapienza.
Fang, J., Parriaux, A., Rentschler M. and Ancey, C., 2009. Improved SPH methods for simulating free surface flows of viscous fluids”, Applied Numerical Mathematics, 59(2), 251-271.
Le Touze, D. and Colagrossi, A., 2005. Free-surface prototype problems suitable to investigate particle methods, in: Proceedings of the 20th International Workshop on Water Waves and Floating Bodies.
Oger, G., Doring, M., Alessandrini, B. and Ferrant, P., 2007. An improved SPH method: Towards higher order convergence”, Journal of Computational Physics, 225(2), 1472-1492.
[Test 4] A jet impinging on a flat plate (Molteni and Colagrossi, 2009)
Test Description:
The impingement of a water jet on a flat plate has been considered as a benchmark test for assessment of numerical methods including SPH-based ones (e.g. Molteni and Colagrossi, 2009; Antuono et al., 2010). In this numerical test, a two-dimensional water jet impinges on a horizontal rigid plate without any physical viscosity. This problem is characterized by an initial strong unsteadiness as a result of a water-hammer-type impact of a liquid jet on a rigid plate (Obara et al., 1995). After the jet impact and release of water-hammer-type shock pressure the flow regime becomes steady and the pressure at the stagnation point is the one obtained from the Bernoulli equation. Therefore, this test would firstly help us to check the shock-capturing capability of the numerical schemes. Second, we can assess the performance of the numerical methods in reproduction of a steady state pressure and satisfaction of fluid incompressibility.
Fig. 1 depicts a schematic sketch of the computational domain. A water jet of width L = 0.2 m impinges on a rigid flat plate with a velocity of U = 1.5 m/s. The particle size and calculation time step are initially considered to be d0 = 0.005 m and D(Delta)t = 5.0E-4 s, respectively.
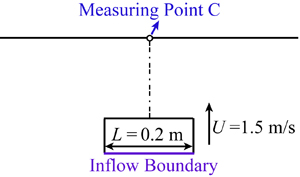
Fig. 1. A jet impinging on a flat plate - schematic sketch of computational domain
Answer by High-Performance Particle Methods:
Fig. 2 illustrates snapshots of fluid particles together with the pressure field at normalized time tU/L = 0.75 just after the jet impact. On the left hand side, we have a snapshot by an improved MPS with two improvements. For this particular test, even two improvements have not been adequate to capture the shock pressure resulting from a water-hammer-type impact. On the right hand side, however, an improved MPS benefiting from four improvements has been able to well reproduce this shock pressure. Fig. 3 shows the spatial distribution of pressure at two other instants, namely, tU/L = 1.0 and tU/L = 2.85 by the improved MPS method enhanced by four different types of improvements. Fig. 4 portrays the step-by-step enhancements in pressure reproduction by refinements of spatial resolution from d0 = 0.0050 m to d0 = 0.004 m and d0 = 0.0025 m.
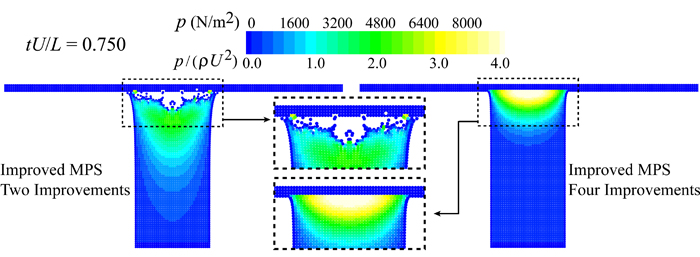
Fig. 2. Snapshots of fluid particles together with the pressure field at normalized time tU/L = 0.75 just after the jet impact.
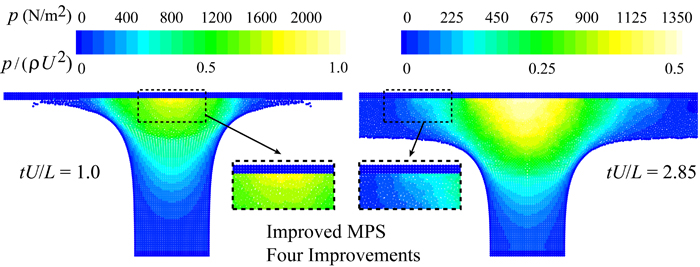
Fig. 3. Spatial distribution of pressure at tU/L = 1.0 and tU/L = 2.85 by the improved MPS method benefiting from four different types of improvements.
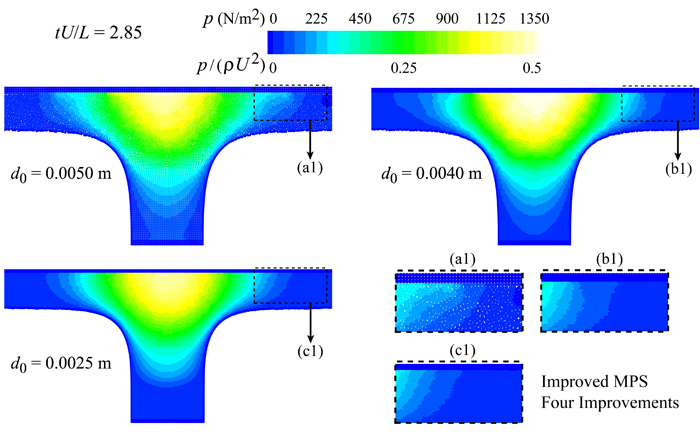
Fig. 4. Enhancements in pressure reproduction by refinements of spatial resolution by decreasing particle size from d0 = 0.0050 m to d0 = 0.004 m and d0 = 0.0025 m.
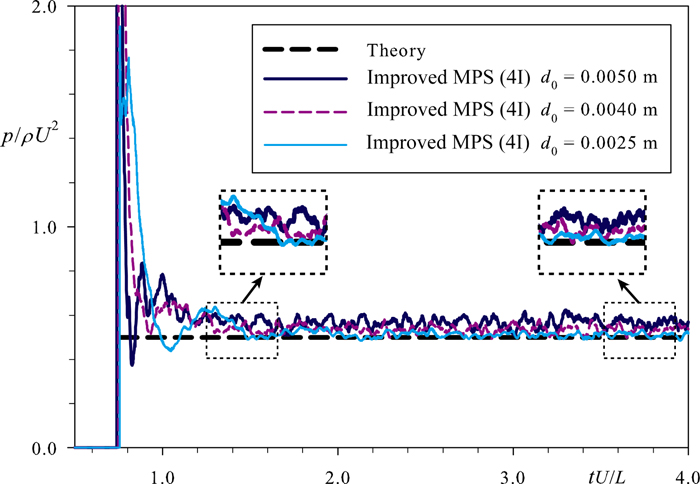
Fig. 5. Time histories of calculated pressure at measuring point C by the improved MPS method benefiting from four Improvements abbreviated by Improved MPS (4I).
Fig. 5 shows the time histories of calculated pressure at measuring point C (stagnation point as shown in Fig. 1) by the improved MPS benefiting from four improvements, abbreviated by Improved MPS (4I). This figure confirms the improvements in pressure calculation by refinements of spatial resolution. Further, it reaffirms the enhanced performance of improved MPS methods in providing a refined and stabilized pressure calculation.
References:
Antuono, M., Colagrossi, A., Marrone S. and Molteni, D., 2010. Free-surface flows solved by means of SPH schemes with numerical diffusive terms. Computer Physics Communications, 181(3), 532-549.
Molteni, D. and Colagrossi, A., 2009. A simple procedure to improve the pressure evaluation in hydrodynamic context using the SPH. Computer Physics Communications, 180(6), 861-872.
Obara, T., Bourne, N.K., and Field, J.E., 1995. Liquid-jet impact on liquid and solid surfaces. Wear, 186-187, part 2, 388-394.